Yes. Hogly can open saved PostHog dashboards and supported Insights on iPhone. To trust the number on a small screen, first check that it represents the same project, time range, filters, and counting method as your web view.
The short version
- Open a saved Insight before rebuilding a metric; its definition matters as much as its chart.
- A funnel counts a sequence for the chosen population, not a ratio of unrelated event totals.
- Keep viewing, editing, and widget compatibility separate when evaluating a mobile client.
Can I use the dashboards my team already built?
Yes. Start with the existing dashboard in the correct PostHog project and open the Insight you care about. Hogly renders supported results in native views, including common trend and funnel charts. You do not need to create a separate analytics project just to look at your existing work from a phone.
For an initial check, choose a simple saved Insight whose result you understand. An impressive dashboard containing many unrelated cards makes discrepancies harder to isolate. Once a single chart agrees, move to the other views your team actually uses.
This guide was reviewed October 16, 2026 against Hogly's implementation and public product information. The example below is fictional and calculated from its stated rules; it is not a measurement from a live customer workspace.
Why might the phone and web show different numbers?
First confirm that both views are asking the same question. A dashboard can apply context that is easy to miss when opening an individual saved Insight elsewhere. PostHog documents its dashboard controls; do not assume that two views share every override just because their titles match.
- Identity: same host, organization, project, and saved Insight.
- Time: same explicit start and end, project time zone, and comparison period.
- Population: same property filters, test-account exclusions, and user or group aggregation.
- Calculation: same event definitions, unique-person versus event count, breakdown, and funnel window.
- Freshness: refresh both views and note when their data was fetched.
If a number still differs, record those settings and the observed values before changing the query. A configuration difference is useful evidence; editing at random makes the original discrepancy harder to reproduce.
What should a small conversion funnel actually show?
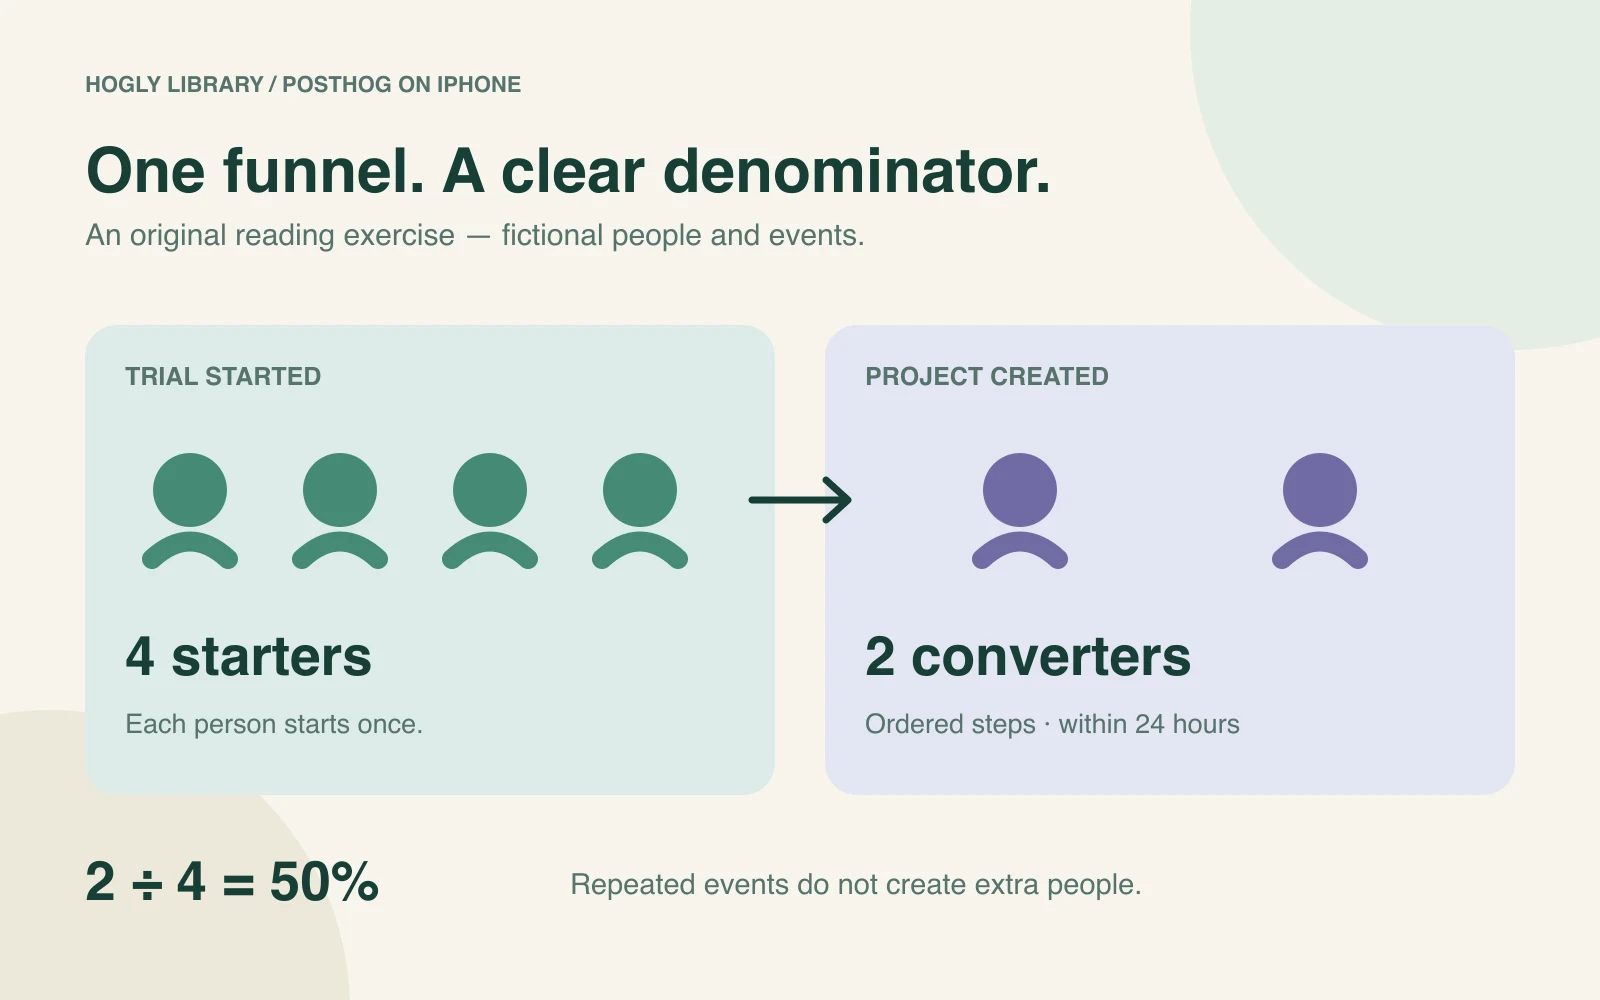
Consider a fictional ordered, two-step funnel: trial_started followed by project_created, counted by unique person, with a 24-hour conversion window. All starts below occur on October 1 at 09:00 UTC. Observe through October 3 so every person has had time to convert. There are no exclusions, breakdowns, or later repeat starts.
- Person A: starts once; creates a project one hour later. Converts.
- Person B: starts once; never creates a project. Does not convert.
- Person C: starts once; creates projects two and three hours later. Converts once.
- Person D: starts once; creates a project 25 hours later. Misses this conversion window.
The expected result is four starters, two converters, 50% conversion. There are four project-creation events in total, but dividing those events by four starters would incorrectly suggest 100%. Repeated events and out-of-window completions explain the difference.
Use this arithmetic as a reading exercise, or reproduce the exact fixture in a dedicated test project. If you change the window, order, identity, or counting method, recalculate the expected result. The PostHog funnel documentation explains the configurable semantics.
Can I create or edit Insights from my iPhone?
Hogly includes creation and editing for supported Insight definitions, including trends and funnels. Editing is a separate capability from rendering a saved result and may require Pro plus write permissions. Read the definition before saving; a change to a shared Insight can change what teammates see.
For a safe first experiment, work with a separate test Insight rather than modifying a team's main activation dashboard. Check the step events, order, conversion window, and date range after saving. If an advanced configuration is not represented clearly in the mobile editor, use PostHog web to inspect it instead of assuming the missing control has no effect.
The recorded Hogly tour includes dashboard and Insight chapters using sample data. It helps you recognize the workflow; your own saved query is the acceptance check.
Does every web visualization also work as a widget?
No. The in-app chart renderer and the widget renderer have different jobs. A table or user-path view may be useful in the app without being suitable for a glanceable widget. A compact Lock Screen value has even less room for context than a Home Screen chart.
For a funnel, keep the step definitions and denominator close to the percentage. A large percentage without the population or time range can be misleading. Use the chart in the app for investigation, then choose a compatible widget only for the quick check you actually need. The widget guide lists supported source families and explains why some charts do not offer a Lock Screen summary.
What should I do when a funnel needs investigation?
A conversion change tells you where to look; it does not explain the cause. Start with a relevant person or session, inspect what was captured, and compare a few examples before making a product decision. A missing event can mean a tracking gap as well as a missing user action.
Follow the Person activity guide when the question becomes “What happened to this user?” For a lightweight daily routine across several products, use the existing multi-project Overview guide.
If you are still choosing a client, return to the PostHog iPhone app checklist. Test one real dashboard and one saved funnel before deciding whether a mobile app fits your work.
Quick answers
Frequently asked.
Can Hogly show a saved PostHog funnel on iPhone?
Yes, Hogly renders supported saved funnel Insights. Verify the project, date range, filters, step order, and conversion window when comparing with the web.
Why is a ratio of event counts different from funnel conversion?
A person-based ordered funnel counts people who complete the required sequence within its window. Repeated or out-of-window events can inflate a simple event-count ratio.
Does chart viewing imply I can edit every query setting?
No. Viewing results, editing supported definitions, and displaying widgets have different support and permission requirements.